The Debugger Compiled the String: CVE-2026-102870
The breakpoint was ordinary. The value was not.
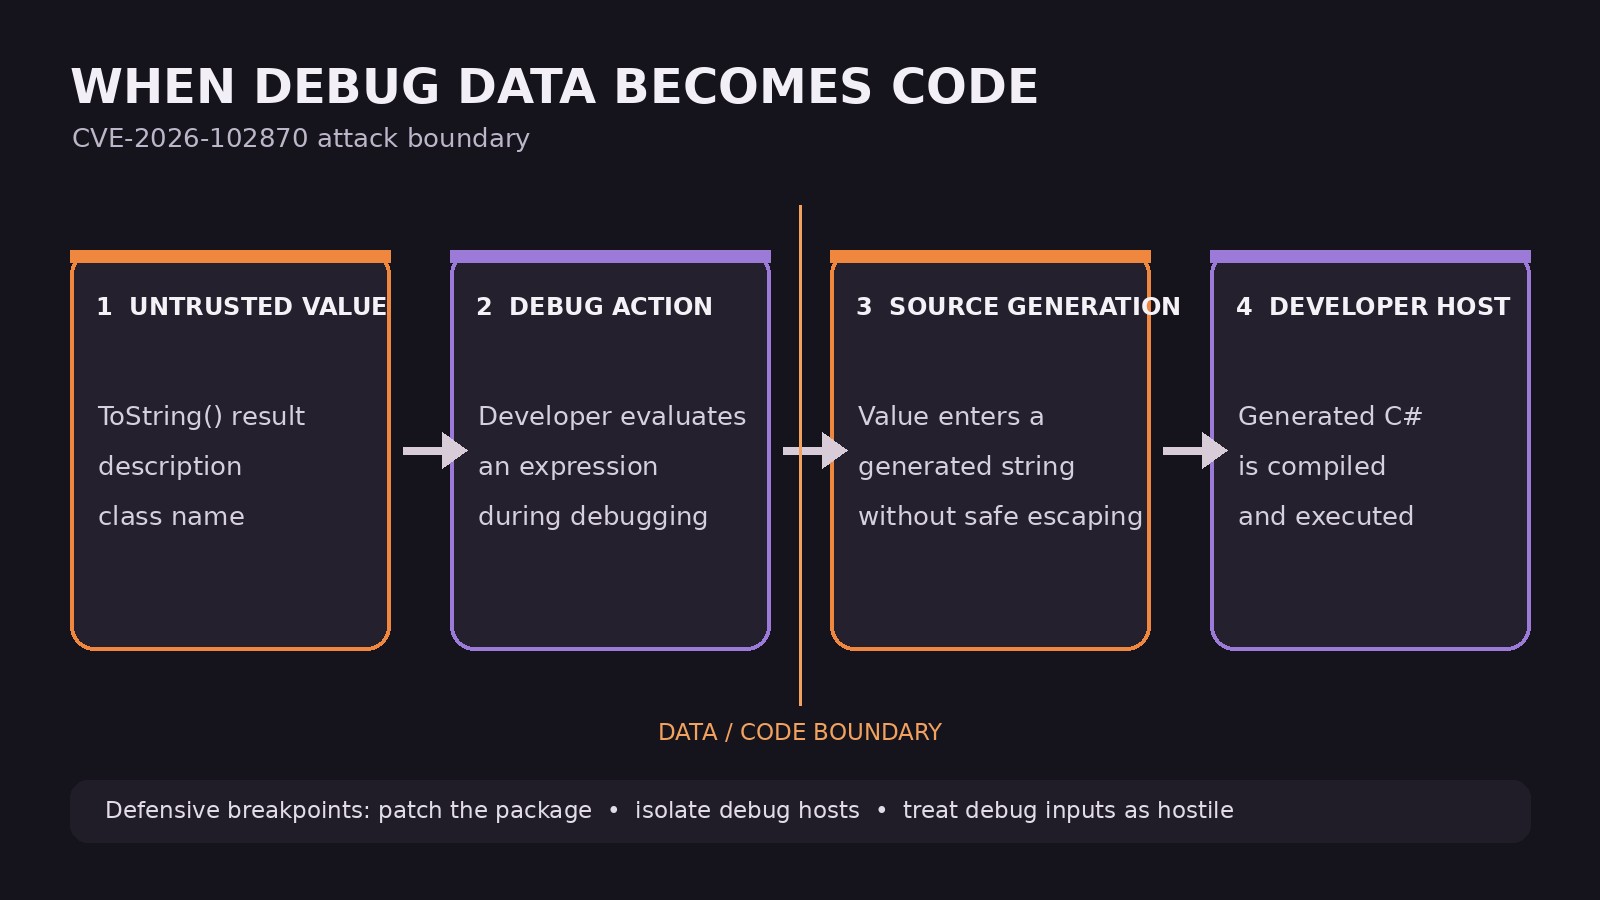
In this composite scenario, a developer reproducing a hostile input pauses a Blazor WebAssembly application and evaluates an expression. The debugger shows an object whose ToString() output looks like data. Behind the interface, the debug proxy takes that value, inserts it into generated C# source, and compiles it. The inspection step has quietly changed the security domain: application data is now source code on a developer workstation.
That is the boundary exposed by CVE-2026-102870. Microsoft describes a code-injection flaw in the Blazor WebAssembly debugger included with Microsoft.AspNetCore.Components.WebAssembly.Server. Attacker-controlled ToString() results, descriptions, and class names could be embedded into generated source without consistent escaping. Code execution occurs when a developer evaluates an expression involving that data during debugging.[1][2]
This is not a drive-by browser exploit. It is a developer-tooling chain with user interaction, which explains the CVSS 3.1 vector AV:N/AC:L/PR:N/UI:R/S:U/C:H/I:H/A:H and 8.8 score.[1][3] The distinction narrows the preconditions, but it does not make the impact theoretical. Developer hosts tend to hold repository access, package credentials, signing material, cloud sessions, and paths into build systems.
The dangerous transition is data to source
Generated code is not inherently unsafe. The failure appears when a program treats an untrusted value as a fragment of the language being generated rather than as a value represented inside that language. A quote, newline, interpolation token, or language delimiter can terminate the intended literal and introduce a new statement. MITRE classifies this family as CWE-94, improper control of generated code.[5]
The important question is not whether the original object is executable. It is whether any representation of that object crosses a code-generation boundary. In the disclosed chain, the relevant representations include:
- an object’s
ToString()result; - debugger descriptions;
- class names used while constructing an expression;
- any derived text that is later placed into generated C#.
The operator’s mental model matters here. A pentester who sees a hostile value rendered safely in the application might initially mark it as non-exploitable. A security engineer might verify that Razor encoding, DOM sinks, and API serialization are correct. Both can miss the second interpreter on the developer side. The application consumes the value as data; the debugger later consumes a representation of the same value as source.
This resembles the trust error behind Jenkins Stapler data binding: a seemingly descriptive structure gains behavior because a framework resolves it through a more powerful mechanism. It also rhymes with A2UI action injection, where data shaped like interface metadata can acquire authority at the rendering boundary. The shared lesson is not “never generate.” It is to identify the point where passive material becomes an instruction.
A realistic attack chain
The chain has five decisions, and each one affects exploitability.
1. Seed an attacker-controlled value. The advisory does not identify a universal ingress. The value could originate in application state, a response, a stored record, or another source the target application exposes. Treat the ingress as application-specific rather than assuming one HTTP endpoint or payload.[1][2]
2. Make the value interesting enough to inspect. The attacker benefits when the value appears inside a failure, an unexpected object, or a bug report that a developer is likely to debug. Social context can therefore carry part of the exploit. The technical trigger is not merely delivery; it is persuading normal troubleshooting activity to reach the hostile representation.
3. Reach the vulnerable debug path. Microsoft states that the affected condition requires a vulnerable Microsoft.AspNetCore.Components.WebAssembly.Server version and expression evaluation during Blazor WebAssembly debugging.[1] Microsoft documents that Blazor WebAssembly debugging uses browser developer tooling and an ASP.NET Core debugging proxy, which places the proxy directly in the investigation path.[4]
4. Break out of the generated literal. The value escapes its intended syntactic container because the source generator does not apply consistent escaping. The exact vendor payload, generated method, and compiler invocation are not public in the advisory. Any article presenting those missing details as a working CVE exploit would be guessing.
5. Execute in the developer context. The generated source is compiled and evaluated by the debugger. Impact then follows the privileges and credentials of the development environment, not the privileges of the remote application user. That is why developer workstations should be modeled as sensitive execution infrastructure rather than ordinary endpoints.
The human step is easy to underestimate. User interaction lowers automation, not consequence. CISA’s CVE enrichment marked the issue as not automatable and recorded no known exploitation at the time of its assessment, while rating the technical impact as total.[3]
A safe mechanism lab
The following is a generic source-generation lab, not a Blazor PoC and not an implementation claim about Microsoft’s code. It runs locally, opens no listener, touches no external target, and uses a harmless boolean as the only “impact.” I executed it during this review and verified both the vulnerable and fixed paths.
import json

payload = 'ordinary"\nlab_state["escaped"] = True\n#'

def vulnerable(value):
    lab_state = {"escaped": False}
    source = f'captured = "{value}"\n'
    exec(compile(source, "<generated>", "exec"), {"lab_state": lab_state})
    return lab_state["escaped"]

def fixed(value):
    lab_state = {"escaped": False}
    source = f"captured = {json.dumps(value)}\n"
    namespace = {"lab_state": lab_state}
    exec(compile(source, "<generated>", "exec"), namespace)
    assert namespace["captured"] == value
    return lab_state["escaped"]

assert vulnerable(payload) is True
assert fixed(payload) is False
The executed assertions returned:
VULNERABLE_SOURCE_ESCAPE=True
FIXED_SOURCE_ESCAPE=False
FIXED_VALUE_PRESERVED=True
The vulnerable function performs textual substitution before parsing. The fixed demonstration serializes the value into a valid quoted literal. In production compiler tooling, a stronger design is to construct syntax trees from typed nodes or pass values separately from generated code. Escaping is context-sensitive, and a correct string-literal encoder is not a universal fix for identifiers, expressions, comments, or nested language contexts.
Scope the patch correctly
The GitHub advisory lists Microsoft.AspNetCore.Components.WebAssembly.Server 10.0.0 through 10.0.12 as affected and 10.0.13 as patched. It also lists .NET 11 preview 1 through RC1 as affected, with 11.0.0-rc.2.26478.115 as the patched package.[2] The CVE record additionally identifies Visual Studio 2022 version 17.14 before 17.14.42 and Visual Studio 2026 version 18.10 before 18.10.4 as affected product ranges.[3]
Start inventory with the runtime, SDK, package graph, and IDE rather than searching only application manifests:
dotnet --info
dotnet list package --include-transitive
Then inspect lock files, CI images, dev containers, cached SDKs, and centrally managed Visual Studio versions. The advisory’s remediation is to install the latest supported .NET version, update the package to the patched release, and restart the debugger and development environment.[1][2]
Do not confuse “the production server does not expose a debugger” with “the organization is unaffected.” This vulnerability targets the debugging workflow. The relevant asset inventory is the set of developer and build-adjacent systems that can open an affected project and inspect hostile state.
Detection is a correlation problem
There is no vendor-specific exploit signature in the public material. Defensive coverage should therefore focus on the transition from expected debugging to unexpected execution.
On developer endpoints, correlate an active Blazor debug session with unusual process creation, script engines, credential access, persistence changes, or outbound connections. Compiler and dotnet activity alone will be noisy. A more useful analytic asks whether a debug or IDE process tree produces a child, file write, or network destination that does not match the repository’s normal build behavior.
At the application boundary, preserve provenance for values likely to reach diagnostic interfaces. Structured logs can record which field, tenant, or request produced an object later inspected during a debugging session. Do not log secrets or raw attacker strings indiscriminately. The purpose is correlation, not creating a second injection sink.
Containment should assume a developer token may be more valuable than the vulnerable application session:
- patch the package, SDK, and IDE before debugging untrusted application state;
- remove standing production credentials from developer workstations;
- use short-lived cloud and package tokens with workload-specific scope;
- isolate debugging and reproduction environments from signing and release systems;
- alert on unexpected child processes and egress from IDE and debug-proxy trees;
- preserve endpoint telemetry when a suspicious value and a debug session overlap.
This is the defensive complement to the PraisonAI sandbox policy gap published earlier this week. That incident asked whether a declared policy constrained runtime capabilities. CVE-2026-102870 asks a different question: whether an investigation tool accidentally upgrades hostile data into developer-context code.
Strategic takeaways
The exploitability gate is narrow but operationally plausible: attacker-controlled application data, a vulnerable debugging stack, and a developer evaluating an expression. The blast radius can still be large because the final security principal is the developer, not the untrusted application user.
Security reviews of developer tooling should map every hidden interpreter: template engines, expression evaluators, source generators, debug adapters, code formatters, test runners, and preview servers. For each one, identify which values are attacker-controlled, where those values become syntax, and which principal executes the result.
CVE-2026-102870 is a useful reminder that debugging is not observation-only. Once a tool generates and compiles code to explain a value, the debugger becomes part of the attack surface. Patch it like production software, instrument it like an execution system, and keep hostile state away from privileged developer contexts until both are true.
Sources
- Microsoft Security Advisory CVE-2026-102870 (published October 13, 2026)
- ASP.NET Core Security Advisory GHSA-g27p-qf6j-c96c (published October 13, 2026)
- CVE-2026-102870 record (published October 13 and updated October 14, 2026)
- Microsoft Learn: Debug ASP.NET Core Blazor apps (accessed October 14, 2026)
- MITRE CWE-94: Improper Control of Generation of Code (accessed October 14, 2026)
💜 Enjoyed this content? Support the blog with USDT (TRC20):
TX7obcjHQbDUXb4mGqoASEu1QFTKT2CFGG